Using the Stock Chart
Ranges, chart types, studies, levels, events and the measure and draw tools.
5 min readIncludes a walkthroughStocks and Research
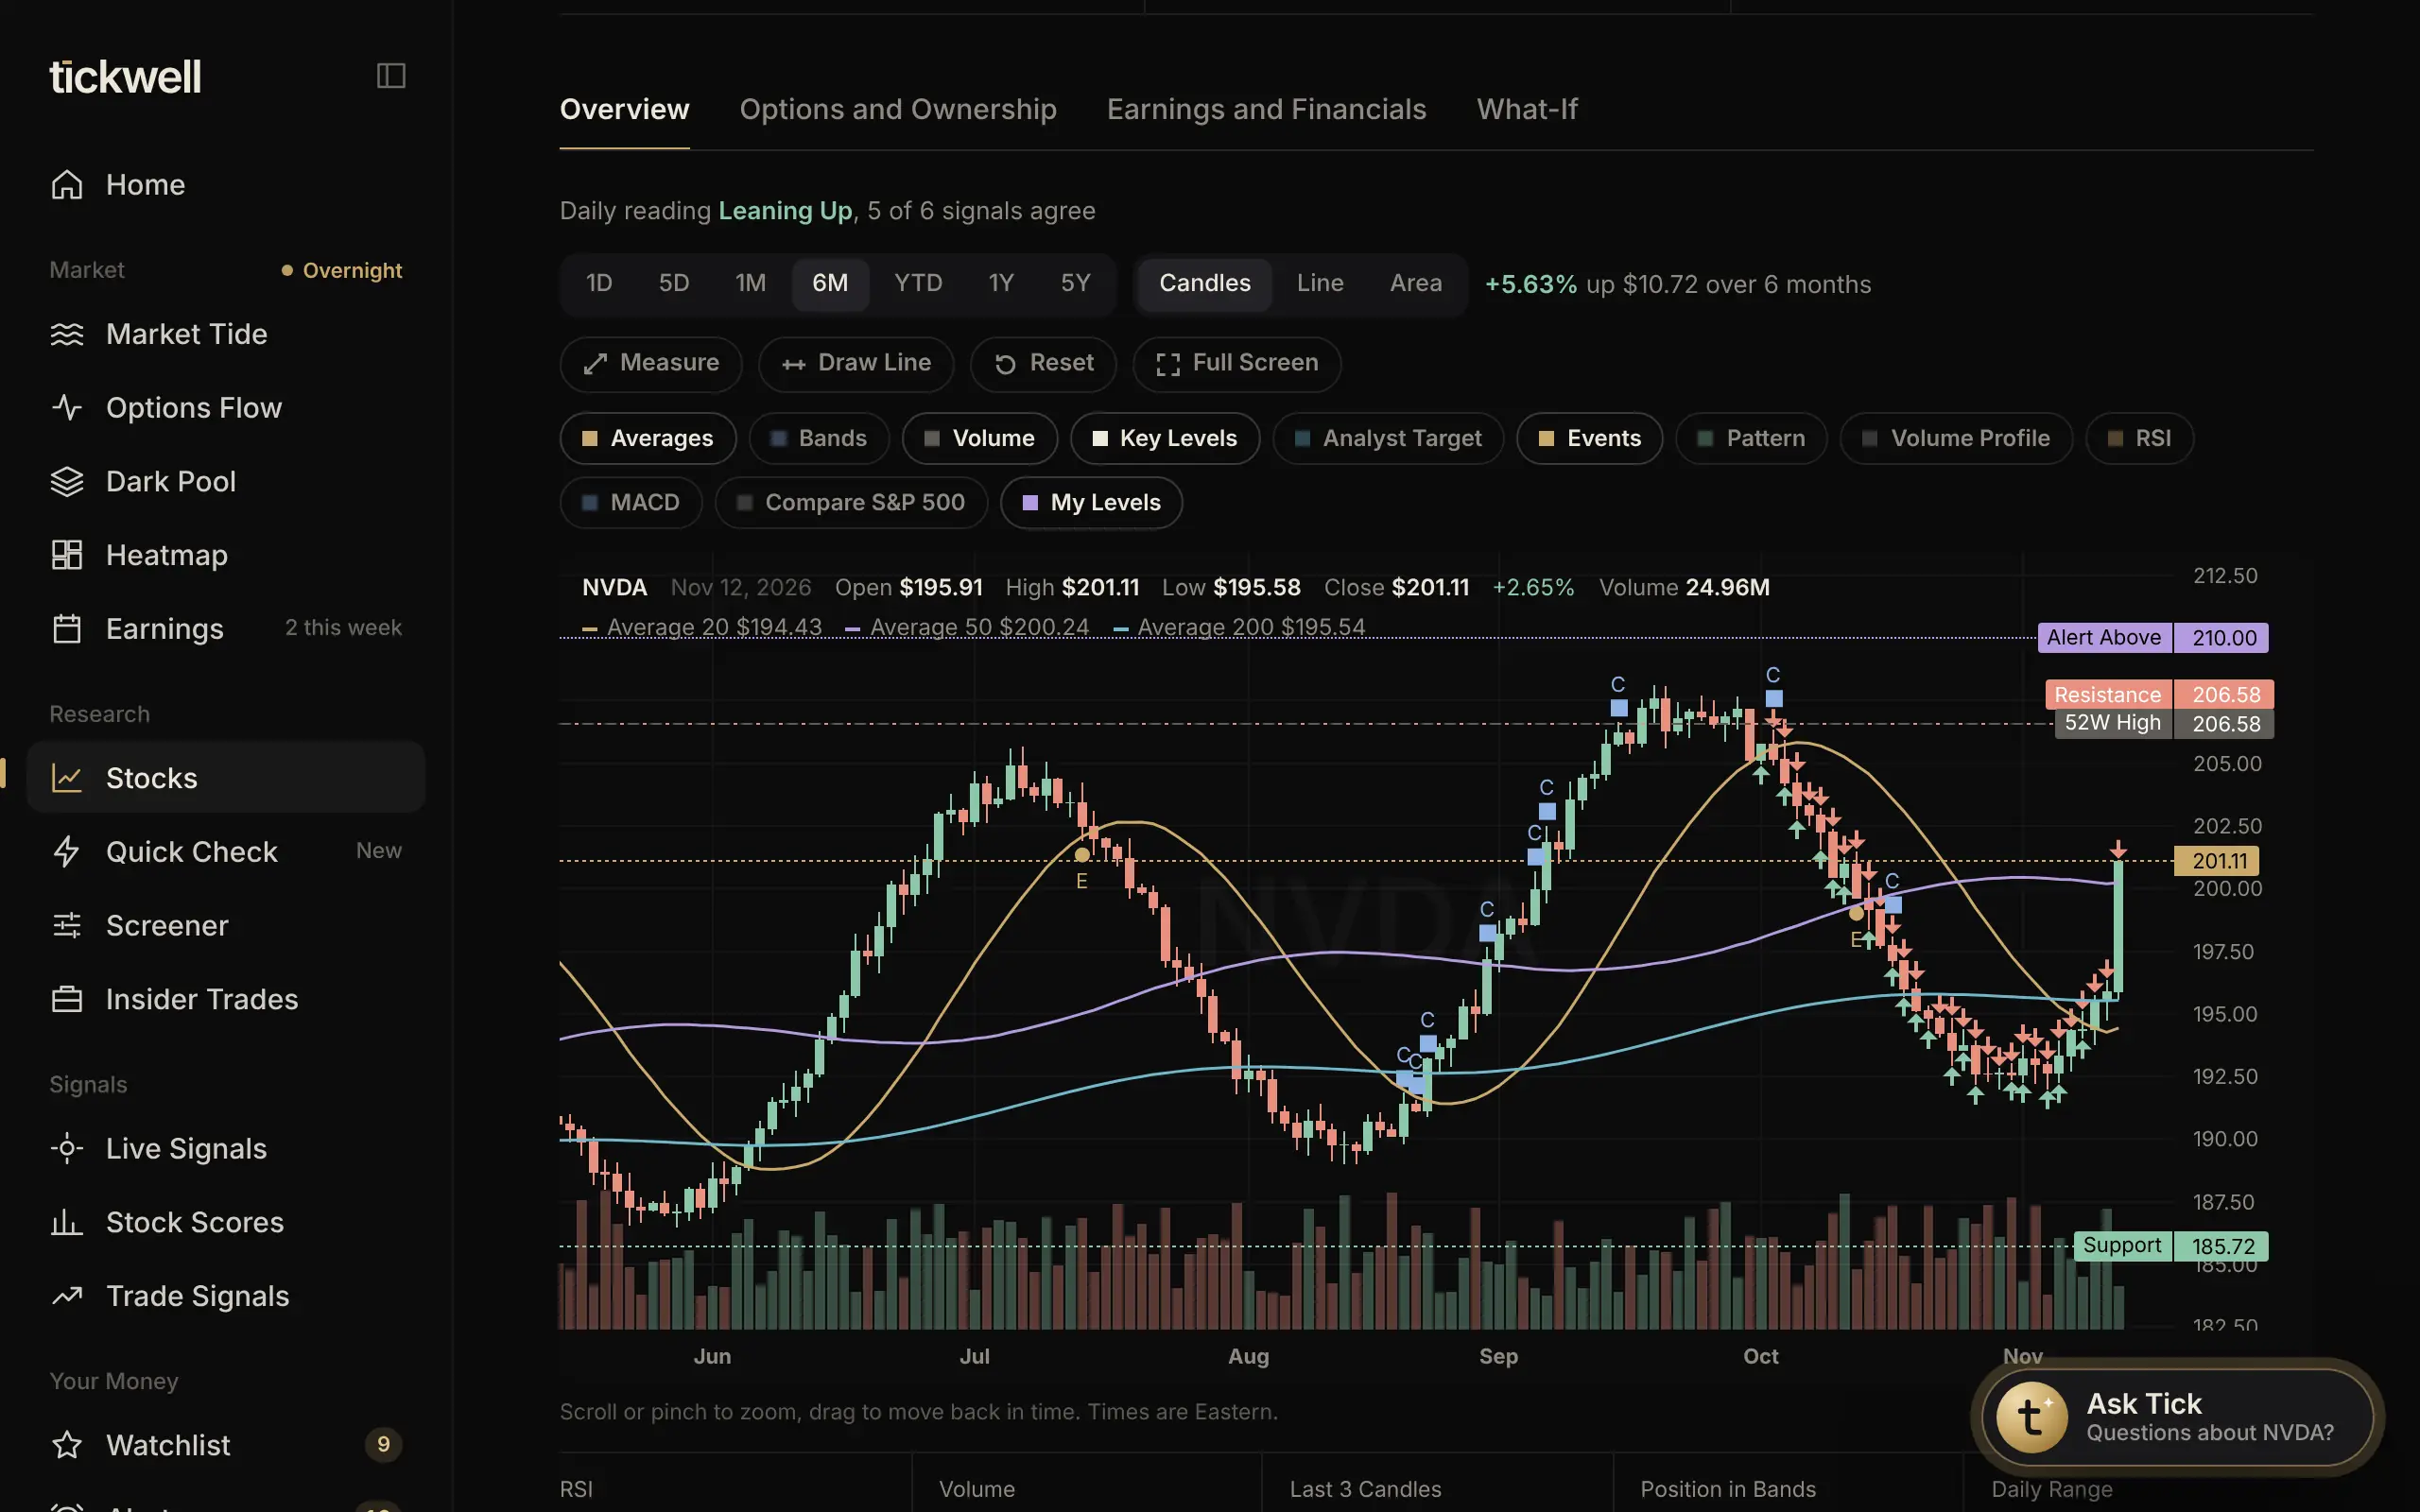
The chart on every stock page is a full charting tool. Your settings are remembered for next time.
Ranges and Chart Types
Pick a range from 1D (today, 5-minute bars) to 5Y (weekly bars). Choose Candles, Line or Area. Scroll or pinch to zoom, and drag to move back in time. The line next to the buttons shows how much the stock moved over what's on screen.
Studies
Turn studies on and off with the chips under the chart:
- Averages: 20, 50 and 200-day lines (9 and 21 bars on intraday ranges).
- Bands: Bollinger Bands, two standard deviations around the 20-day average.
- VWAP: the average price weighted by volume, on intraday ranges.
- RSI and MACD: momentum, in their own panels below the chart.
- Pattern: labels swing highs and lows as higher highs, higher lows, lower highs and lower lows.
- Volume Profile: where the most shares traded, with the most traded price marked.
- Compare S&P 500: both lines in percent, with how far ahead or behind the stock is.
Levels and Events
Key Levels draws support, resistance, the previous close and the 52-week high and low. Analyst Target adds the average target. My Levels shows your alerts, your average cost from a connected broker, and lines you draw. Events marks earnings (E), insider buys and sells (arrows) and Congress trades (C). Point at a day to see the details.
Tools
- Measure: select Measure, click where a move starts, then where it ends. You'll see the percent and dollar change and how long it took.
- Draw Line: select Draw Line and click the chart to add a price line. Lines are saved for that stock; Clear Lines removes them.
- Full Screen gives the chart the whole screen. Press Esc to leave.